
 Image Source: Gold has not gone anywhere in the last couple of weeks but remains only slightly below the all-time high of $2685 it hit in late September. Following a sharp recovery at the back end of last week, gold’s momentum faded on Monday, perhaps on disappointment about the lack of details of China’s stimulus measures announced on Saturday. While the metal was rebounding slightly at the start of today’s session, it remained to be seen whether the bulls had conviction to hold their ground. As well as disappointment regarding China’s stimulus, we haven’t seen any major escalations in the Middle East conflict, while the US dollar and bond yields also remain well supported. On top of this, technical indications suggest gold prices remain significantly overbought. All this means the scope for a decent downward move is there, if the bears dare try to step in against what has been one of the strongest bullish trends in gold and ahead of US presidential election. Despite these signs, I will only turn bearish once we see a confirmed technical reversal pattern on the charts of XAU.
3 factors that could hold gold back
While the upcoming US election uncertainty should be a supporting factor for gold, the fact that we haven’t seen any new all-time highs in XAU/USD since 24th September while the positively correlating to new unchartered territories can be explained away by three major factors.
First, there has not been any major escalation in the Middle East conflict, the result of which saw crude oil prices slump. Later yesterday, media reports that Israel is not planning to hit Iran’s oil and nuclear facilities caused oil prices to fall by $2-$3 in the space of a few minutes. This has also reduced the haven appeal of gold somewhat.
Second, gold traders are keeping an eye on risk-free rates and the dollar. After all, the US 10 year bond yield is holding steady above the 4.0% mark, as the US dollar remains near a 2.5-month high. Yields and the dollar have been supported by the belief that the Federal Reserve will slow down its pace of interest rate cuts. Fed Governor Waller has emphasised that the central bank should take a more cautious approach when considering future outsized rate cuts.With no major US economic data set to be released today, markets are likely to pay close attention to comments from FOMC member Mary Daly, as her neutral stance could give a good indication of where the committee’s consensus lies following the stronger-than-expected jobs and inflation data last week. Daly’s remarks could provide further insight into the Fed’s current thinking on monetary policy and thereby have an influence on the short-term gold forecast.
China’s latest stimulus measures initially provided some support for all sorts of commodity prices, when they were announced in the last week of September. However, there’s uncertainty over whether they’ll be enough to push GDP growth back to the 5% target. Over the weekend, the Finance Ministry failed to alleviate those concerns as key details—like the size and timing of the measures—were left out. This raises questions about whether the stimulus will have the desired impact on the economy, especially given the challenges China is facing. For now, markets are cautiously optimistic, but there’s still some scepticism about the effectiveness of these efforts. We have seen Chinese stock markets, and China-linked asset prices, like copper, fall.
Gold technical analysis and trade ideas
The technical for now, but with prices hovering at extreme overbought levels on higher time frames, we could be seeing a potential bearish reversal soon – especially if the dollar continues to strengthen. That said, before calling a top, we’ll need clear confirmation that this rally is running out of steam, because so far, every little or not-so-little dip have been bought.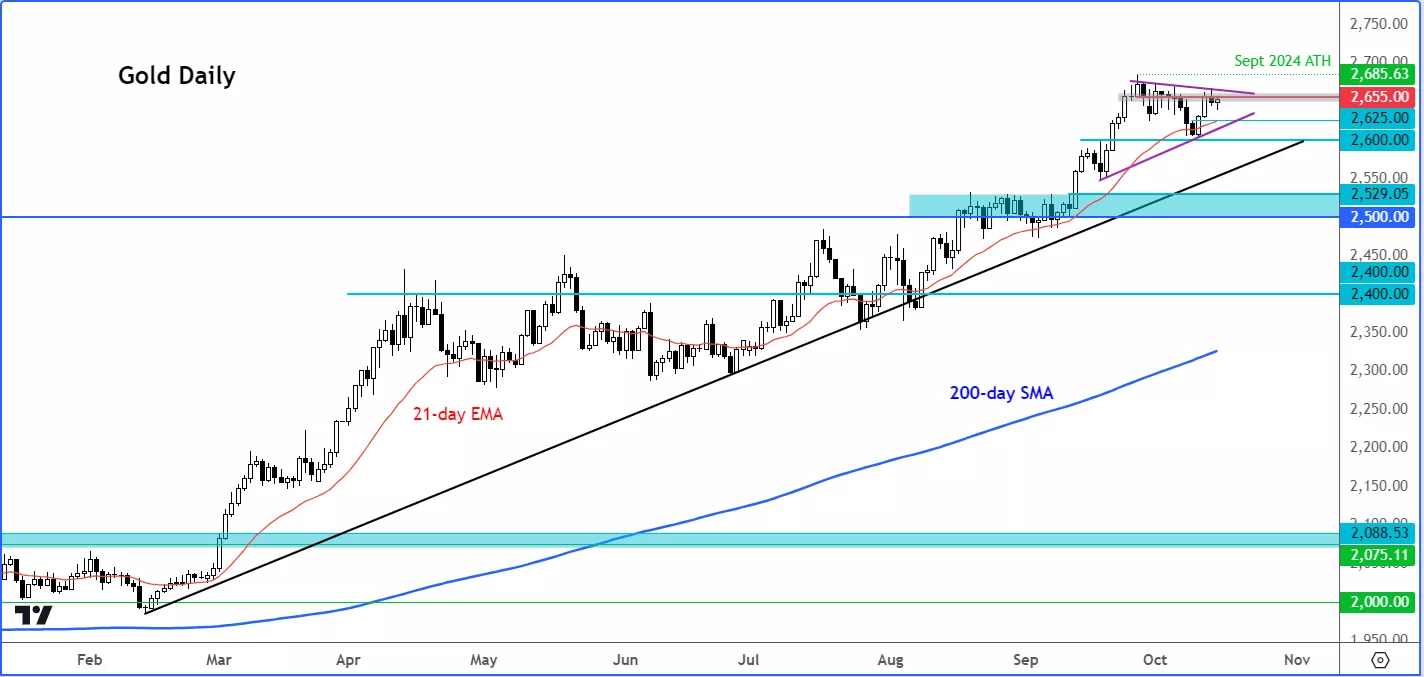 There are several key support levels to watch if gold does dip, starting with $2625. Last week’s low was formed at just north of $2600, which is now a critical level to watch. Below that, the 2024 bullish trend line near $2550 could also provide additional support if the market pulls back further.Looking at the bigger picture, gold appears primed for some profit-taking. Historically, whenever the Relative Strength Index (RSI) crosses above the overbought threshold of 70.0 on higher time frames – as it has now, with the weekly at around 75.0 and monthly above 80.0 – we typically see a period of consolidation or selling pressure to ease those overbought conditions.
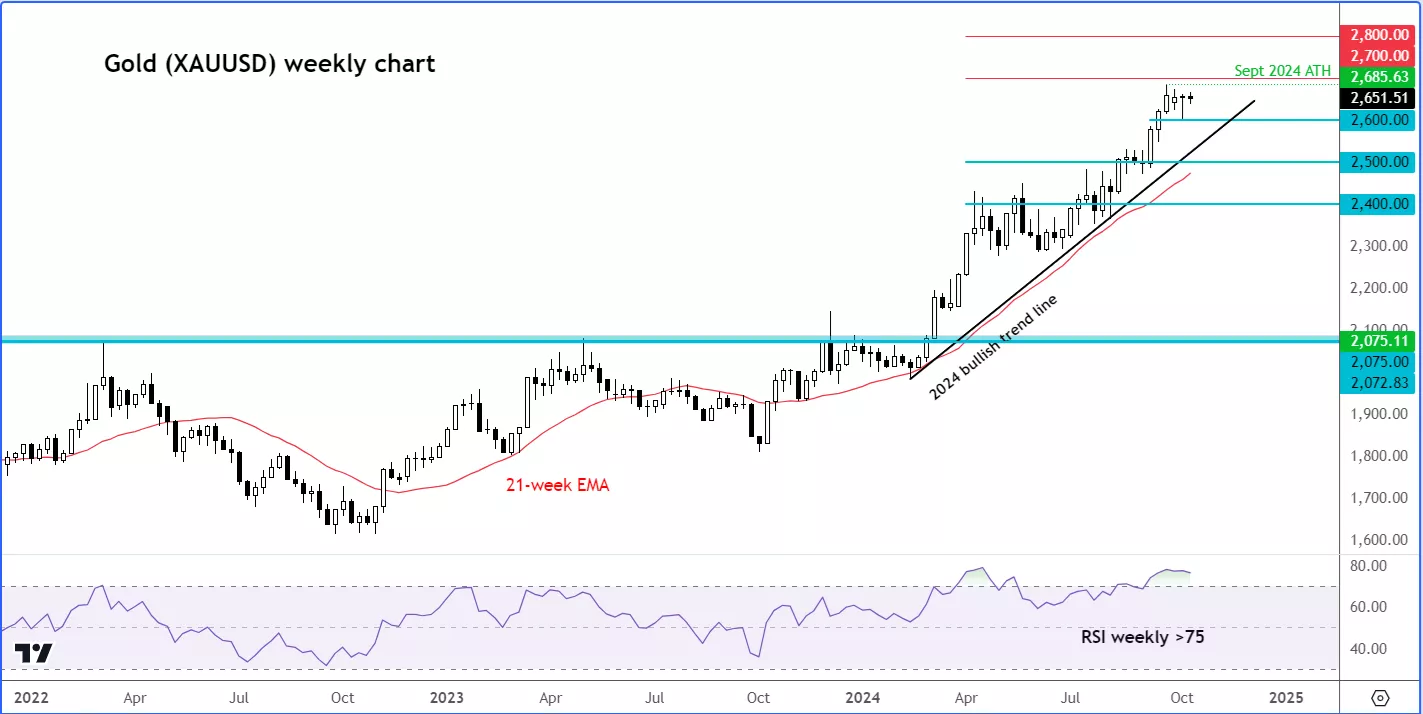 Right now, the monthly RSI is at levels that haven’t been seen since the height of the pandemic in 2020. And we all remember what happened to gold after that.
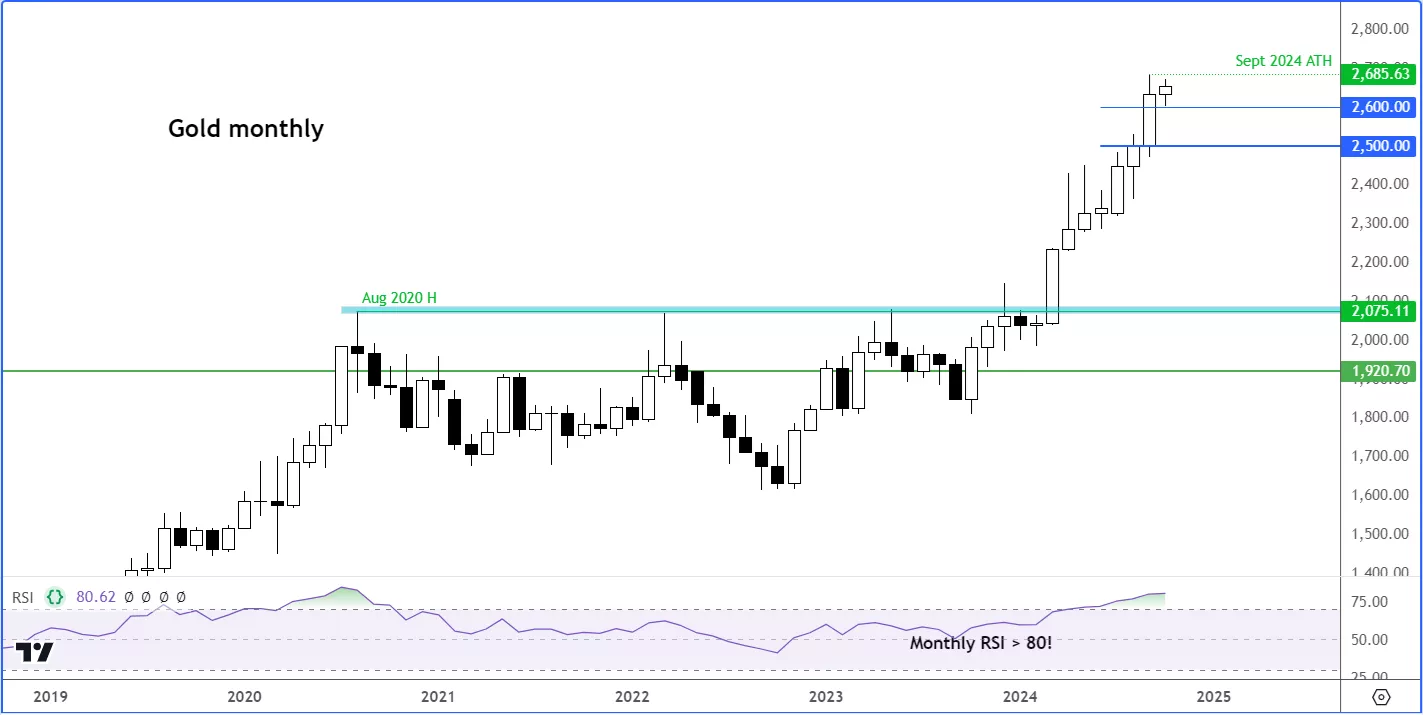 While the RSI hints at a correction, it’s not a definitive sell signal. We’ll need to see a reversal hold on the daily or lower time frames. Gold’s uptrend is still intact, and it’s hard to predict how much higher it could go before a pullback. Still, a brief dip or consolidation would be healthy before gold resumes its upward momentum. If you’re long on gold, don’t hesitate to take profits at the first sign of weakness. My long-term target remains $3000, but I’d prefer to see a dip shake out weaker hands before the next big move higher.More By This Author:EUR/USD Faces Continued Downside Risk Ahead Of US CPIS&P 500: Stocks ease ahead of US jobs and amid raised geopolitical risksGBP/USD Faces A More Uncertain Outlook After Scoring A Hattrick Of Monthly Gains
