The USD/CAD price analysis shows a slight retreat, with fundamentals supporting further upside. The Canadian dollar traded near a 10-week low after inflation numbers were lower than expected. Meanwhile, the greenback remained firm, with higher expectations for a small Fed rate cut in November.Canada’s annual inflation eased more than expected to 1.6% in September, raising the likelihood of a massive October Bank of Canada rate cut. Canada’s central bank recently shifted its focus to preserving growth. At the same time, policymakers are worried inflation might fall too much. Therefore, there is a lot of pressure to lower borrowing costs. After the CPI report, market participants raised the likelihood of a 50-bps rate cut from 50% to 74%. The loonie has fallen sharply in the past few weeks due to a strong dollar and a drop in oil prices. Oil fell sharply on Tuesday after reports that Israel might not hit Iranian oil. Previously, oil had risen due to an escalation in the Middle East war. However, tensions have cooled, removing the premium on oil.Meanwhile, the dollar held steady as market participants adjusted to the new outlook for Fed rate cuts. Notably, policymakers have assumed a more cautious tone, with some expecting only one more rate cut this year. Traders are awaiting the US retail sales report for more insight into the economy’s health. Moreover, the report will impact rate cut expectations. USD/CAD key events todayMarket participants do not expect high-impact data from the US or Canada today. Therefore, they will keep digesting the new outlook for BoC rate cuts. USD/CAD technical price analysis: Bears trigger after RSI divergence(Click on image to enlarge)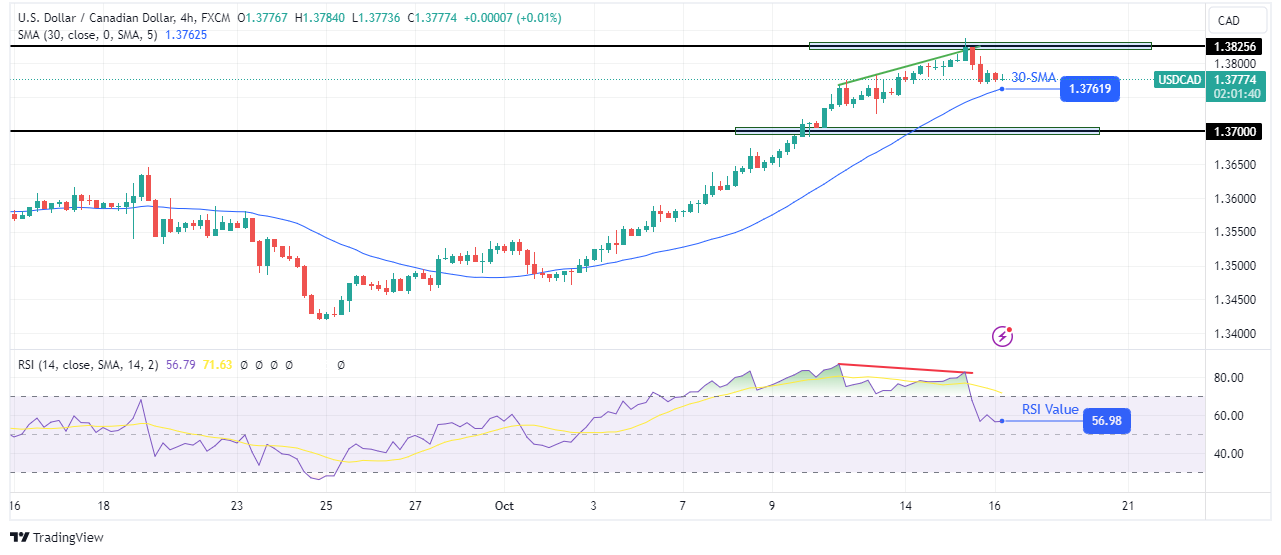 USD/CAD 4-hour chart On the technical side, the USD/CAD price has retreated after finding resistance at the 1.3825 level. The pullback comes after a steep bullish rally that showed fading momentum when the RSI made a bearish divergence. However, the bullish bias remains intact since the price trades above the SMA with the RSI above 50. Therefore, it might find support at the SMA before bouncing higher. A break above 1.3825 would confirm a continuation of the bullish trend. However, if bulls fail to make a higher high, bears might take charge with a break below the SMA. More By This Author:GBP/USD Price Analysis: Sterling Gains Despite Downbeat DataAUD/USD Outlook: Aussie Nosedives After RBA MinutesGBP/USD Forecast: Bailey Hints At Aggressive Rate Cuts
USD/CAD Price Analysis: CPI-led Rally Fades Below 1.3800

