 Image Source:
The S&P 500 rose 20.8% during the first three quarters of 2024, which is its best start since 1997 and the best for any presidential election year in history. Moreover, for perspective, the ratio of US stock market capitalization to the global stock market has risen from 30% in 2009 (following the GFC) to almost 50% today. This has happened despite escalation in multiple wars, numerous catastrophic weather events ravaging the country, a highly contentious election tearing apart friends and families, strapped consumers (after 25%+ cumulative inflation over the past few years), falling consumer confidence, and jobs and GDP growth over-reliant on government deficit spending, with national debt approaching $35.7 trillion and rising $2 trillion/year (as debt carrying costs alone cost over $1 trillion/year). Even over the past several days when oil prices spiked above $75/bbl (on sudden escalation in the Middle East conflict) and bond yields surged (with the 10-year reaching 4.05%), the major indexes continue to hold near their highs.As investor Howard Lindzon (of StockTwits fame) said the other day, “There is a fear trade happening (e.g., gold and bitcoin) while there is growth trade happening. It’s really mind-boggling.” Indeed, many of the most prominent investors are wary, including the likes of Warren Buffett, Jamie Dimon, and Jeff Bezos, and corporate insider buying has slowed.I’m not an economist. I started my career as a structural engineer with Chevron Corporation, then earned an MBA in night school and moved into the business side of the company before venturing into the world of investment research. But as a long-time student of the economy and capital markets, combined with my critical-thinking nature and engineering training, I’ve developed a healthy skepticism of numbers presented to me, even from supposedly objective sources like the government. They have to pass the “smell test.”Of course, the Fed has been basing its monetary policy primarily on metrics calculated by federal agencies regarding inflation, jobs, and GDP. But headline YoY numbers can be illusory—particularly when they are propped up by massive government deficit spending. So, I like to look beyond the headline numbers. For inflation, my skepticism of official numbers (with the long lag times of key components, like shelter cost, and distorted metrics like “owner’s equivalent rent,” which is highly subjective and based on surveys of homeowners) is why I seek alternative metrics like: 1) the annualized rolling 3-month average of month-over-month price changes (which better reflects current trends), 2) a European method (quietly published by the BLS since 2006) called the Harmonized Index of Consumer Prices (HICP), and 3) the real-time, blockchain-based Truflation, which is published daily.My skepticism was further elevated when I saw the jobs, retail sales, and ISM Services metrics all suddenly perk up in September—right before the election after a lengthy period of decline and contrary to several negative developments like a record divergence between rising consumer credit card debt and falling personal savings and The Conference Board’s Consumer Confidence dropping to the bottom of its 2-year range and showing increasing pessimism about labor market conditions.On the other hand, it is notable that Truflation also has risen quickly over the past couple of weeks to nearly 2.0% YoY, so could this be corroborating the apparent rise in consumer demand? Could it be that the Fed’s dovish pivot and 50-bps rate cut has suddenly emboldened consumers to start spending again and businesses to ramp up hiring? Or are my suspicions correct such that we are in store for more downward revisions on some these rosy metrics post-election? After all, the last set of major revisions in early September showed not just an over-reliance on government jobs and government-supported jobs (through targeted spending bills), but the August household survey showed 66,000 fewer employed than in August 2023, 609,000 more “”part-time for economic reasons,” and 531,000 more “part time for noneconomic reasons,” which implies 1.2 million fewer full-time jobs in August 2024 versus August 2023.Then along came the big 254,000 jobs gain in the September report that made investors so giddy last week, and the household survey showed 314,000 more employed workers than in September of last year. However, digging into the numbers, there are 555,000 more “”part-time for economic reasons” and 389,000 more “part time for noneconomic reasons,” which suggests 630 million fewer full-time jobs in September 2024 versus September 2023, so it’s no surprise that the average weekly hours worked also fell. Furthermore, government spending (and the growing regulatory state) continues to account for much of the hiring as government jobs have soared by 785,000 (seasonally adjusted) over this 12-month timeframe, which was the largest month-over-month (MoM) gain on record. Also, workers holding multiple jobs hit an all-time high. And notably, native-born workers have lost 1.62 million net jobs since their peak employment in July 2023 while foreign-born workers have gained 1.69 million over the same period.Hmmm. I continue to see the GDP and jobs growth numbers as something of a mirage in that they have been propped up by government deficit spending (which our leaders euphemistically call “investment”). As you recall, leading into the September FOMC announcement I had been pounding the table on the need for a 50-bps rate cut, which we indeed got. Many observers, and at least one Fed governor, believe it was a mistake to go so big, but as I discussed in my last month, recessionary pressures were mounting despite the impressive headline numbers, and the pain felt by our trading partners from high US interest rates and a strong dollar essentially required some agreement among the major central banks, particularly Japan and China, to weaken the dollar and thus allow an expansion in global liquidity without inciting capital flight to the US. And the PBOC soon did exactly that—slashing its reserve requirement ratio (RRR), cutting its benchmark interest rate, and loosening scores of rules regarding mortgages and the property market—which has restrengthened the dollar after its summer decline.Of course, cutting taxes and regulation is the best way to unleash the private sector, but it’s often argued that a tax cut without a corresponding reduction in spending only serves to increase the budget deficit and add to the federal debt. In fact, I saw a Harris campaign commercial with an average guy named “Buddy” lamenting that it’s “not cool” with him that Trump would give “billionaires” a tax break because they should “pay their fair share.” But Buddy and Harris both need to know what DataTrek Research has observed—i.e., since 1960, regardless of individual and corporate tax rates, federal receipts have averaged 17% of GDP. This means that raising taxes stunts GDP growth while cutting taxes boosts GDP growth by leaving more money in the pockets of consumers, business owners, and corporations to spend and invest with the wisdom of a free and diverse marketplace (Adam Smith’s “invisible hand”). In other words, the path to rising tax revenues is through strong economic growth—and the best return on capital comes from the private sector, which has proven itself much more adept at determining the most efficient allocation of capital rather than Big Government’s top-down picking of winners and losers, like a politburo.Nevertheless, given the Fed’s dovish pivot (and despite the “heavy hand” of our federal government), I continue to expect higher prices by year end and into 2025. Bond credit spreads remain tight (i.e., no fear of recession), and although the CBOE Volatility Index () is back above the 20 “fear threshold,” it is far from panic levels. So, I believe any “October surprise” that leads to a pre-election selloff—other than a cataclysmic “Black Swan” event—would likely be a welcome buying opportunity, in my view. But besides adding or maintaining exposure to the dominant MAG-7 titans—which provide defensive qualities (due to their disruptive innovation and wide moats) as well as long-term appreciation potential—I think other stocks may offer greater upside as the economic cycle continues its growth run and market rotation/broadening resumes.So, my suggestions are to buy high-quality businesses at reasonable prices on any pullback, hold inflation hedges like gold and bitcoin, and be prepared to exploit any credit-related panic—both as stocks sell off (such as by buying out-of-the-money put options while VIX is low) and before they rebound (when share prices are low). Regardless, I continue to recommend high-quality, fundamentally strong stocks across all market caps that display consistent, reliable, and accelerating sales and earnings growth, positive revisions to Wall Street analysts’ consensus estimates, rising profit margins and free cash flow, solid earnings quality, and low debt burden. These are the factors Sabrient employs in selecting the growth-oriented Baker’s Dozen (our “Top 13” stocks), the value-oriented Forward Looking Value, the growth & income-oriented Dividend portfolio, and Small Cap Growth, which is an alpha-seeking alternative to a passive position in the Russell 2000.We also use many of those factors in our SectorCast ETF ranking model. And notably, our Earnings Quality Rank () is a key factor in each of these models, and it is also licensed to the actively managed, absolute-return-oriented First Trust Long-Short ETF ().Each of our key alpha factors and their usage within Sabrient’s Growth, Value, Dividend, and Small Cap investing strategies (which underly those aforementioned portfolios) is discussed in detail in Sabrient founder David Brown’s new book, How to Build High Performance Stock Portfolios, which is now available for pre-order on at a special pre-order price.And in conjunction with David’s new book, we are also offering a subscription to our next-generation Sabrient Scorecard for Stocks, which is a downloadable spreadsheet displaying our Top 30 highest-ranked stock picks for each of those 4 investing strategies. And as a bonus, we also provide our Scorecard for ETFs that scores and ranks roughly 1,400 US-listed equity ETFs. Both Scorecards are posted weekly in Excel format and allow you to see how your stocks and ETFs rank in our system…or for identifying the top-ranked stocks and ETFs (or for weighted combinations of our alpha factors). You can learn more about both the book and the next-gen Scorecards (and a free sample scorecard).In today’s post, I discuss in greater detail the current trend in inflation, Fed monetary policy, stock valuations, technological trends, and what might lie ahead for the stock market. I also discuss Sabrient’s latest fundamental-based SectorCast quantitative rankings of the ten U.S. business sectors, current positioning of our sector rotation model, and several top-ranked ETF ideas. And be sure to check out my Final Thoughts section with a few off-topic comments on the imminent election and escalating Middle East conflict.
Market Commentary
Let’s continue the topic of taxation and spending. Although I discussed this at length in my , it certainly bears repeating as we head into an important election with two candidates offering starkly different views on taxation, regulation, and spending. Simply put, the economy (i.e., GDP) must grow faster than the budget (i.e., spending). Unleashing the private sector via lower taxes and regulation suggests faster and more sustainable organic GDP growth than government-directed “investment,” i.e., boondoggles, cronyism, and spending bills written by politicians and their donors/lobbyists. It also equates to rising earnings and taxable income—and rising tax receipts. So, rather than raising tax rates on corporations and “the rich” to fund government deficit spending and monetary inflation to stimulate the economy (a la China), it is more effective to cut red tape and put working capital back in the hands of businesses, while keeping money supply growing at a rate in line with the resulting organic economic growth rate.According to the nonpartisan Tax Foundation: “A higher corporate tax rate would raise revenue; however, any revenue would come at a high price of lost economic output, investment and wage growth. For example, under a 28% corporate rate… we estimate that for every $1 of higher revenue on a conventional basis, GDP would fall by $1.84.” It further points out, “Raising the rate to 28% would be a costly mistake, with a large part of the cost falling on workers in the form of lower wages and fewer jobs.” The total loss in wages nationwide could reach $81 billion per year or nearly $1 trillion dollars over the next decade, as well as lead to higher consumer prices.As I discussed last month, there are three ways to dig our way out of this enormous deficit and debt pile: 1) “inflate away” the debt with 2-3% inflation, 2) cut spending and red tape, and 3) foster strong, sustained, organic economic growth, led by the private sector and supported by low tax rates for all. In fact, a combination of all three would spur innovation, R&D, and capital investment; foster robust commerce, competition, and efficient use of capital; and generate rising productivity and wages, higher profit margins, and robust corporate earnings—leading to higher tax receipts.Regarding productivity, there is so much potential, particularly today with the rapid emergence of Gen AI, and perhaps the holy grail of Artificial General Intelligence (AGI). What you see today with the likes of ChatGPT is barely scratching the surface of what is coming just in the next few years, much less 20 years from now. The big opportunity will be when AI adoption accelerates across industries, driving productivity and cost-efficiency. Elon Musk has called AI, “The most disruptive force in history.”Moreover, we look forward to the benefits of blockchain, distributed ledger technologies (DLTs), quantum computing, and high-efficiency/high-transformity energy sources like localized natural gas generators or small modular nuclear reactors—and perhaps eventually the holy grail of energy, i.e., safe, clean, zero-waste, perpetual-energy, nuclear fusion.Blockchain (and its inherent security) also should become an integral part of this transition in energy distribution from a centralized grid run by a handful of utility companies to a decentralized grid owned by individuals. This is just one of many applications, which also may include digital transactions, contracts, data storage, voting, and record keeping in the financial markets, real estate. The imminent blockchain-based Internet will further enhance online shopping in that we won’t have to remember passwords, user IDs, and credit card numbers.AI and automation should be long-term drivers of economic growth and important tools to addressing a demographic shift and structural labor shortage that is expected to expand. Sorry, longshoremen (and many others), but in the longer term, the writing is on the wall. You can hold it at bay for a while with strikes and politicking, but it’s coming—like tractors replacing the plow, cars replacing the horse & buggy, the Internet replacing newspapers and libraries, and smartphones taking over most of our daily tasks and social interactions.
Stock Valuations:Amazingly, the iShares Utilities Sector () is up +30% YTD through last Friday, 10/4, which is the best performance this year among the 10 U.S. sector iShares by a wide margin:Utilities (IDU) +30.4%
Financials () +23.8%
Technology () +23.8%
Industrials () +17.8%
Consumer Discretionary () +15.7%
Telecom () +13.7%
Energy () +13.4%
Healthcare () +12.7%
Consumer Staples () +10.2%
Basic Materials () +8.8%
Suddenly, utility companies are no longer looked upon simply as the boring suppliers of water, power, and trash collection. Instead, many are getting a tailwind not just from their higher dividend yields (in a falling interest rate climate) but also for their nascent role in powering the AI revolution. As for investor-darling Technology sector, this is still where the disruptive innovation and big secular growth winners are mostly likely to be found. Indeed, from an industry standpoint, Semiconductors (), are the leading sector YTD at +41.7%. Other top-performing market segments include Bitcoin, Gold, Gold Miners, Agriculture, which are all up more than 20% YTD (through 10/4).Net long positions in the MAG-7 stocks [Apple (), Microsoft (), NVIDIA (), Amazon (), Meta Platform (), Alphabet (), and Tesla ()] are at the lowest level since May 2023, so it soon might be time to start adding to these names—although according to The Market Ear, net leverage among hedge funds is approaching the July 2023 high, which could be taken as a short-term sell signal, and share buyback programs are slowing. Also, hedge fund net positioning in global energy stocks is around its lowest since early 2021, but buying and short covering appears to be emerging.Heading into Q3 2024 earnings reporting season, according to FactSet, EPS estimates for the S&P 500 in aggregate for Q3 fell to $60.72, and for CY 2025 it has fallen to $276.65, which imputes a forward P/E of 20.8x based on last Friday’s closing price. (Of course, lower interest rates provide a lower discount rate on stock pricing.) Wall Street expects earnings growth will be broadly distributed across sectors, with notable strength in cyclical sectors like Energy, Basic Materials, and Industrials. Indeed, with lower interest rates and a steepening yield curve, I continue to like financials, homebuilders, oil & gas, commodities, and gold and bond proxies like utilities, consumer staples, and REITs.However, here’s a word of caution. There has been a consistent pattern of Wall Street reducing expectations heading into earnings season such that actual earnings (even if they technically “surprise” higher on average due to the lowered estimates) have continued to come in short of early estimates—so the forward P/Es that investors thought they were paying for 12 months in advance, in retrospect, were a good bit higher than anticipated. Indeed, average annual returns on stocks have far exceeded GDP and earnings growth rates. So, if the same is true today, the actual forward P/E on the S&P 500 might be closer to 22.0x—so, not quite as attractive.Today, the forward P/E ratio on the major indexes are quite a bit higher than I reported last month before the big rate cut. The Nasdaq 100 () is now 26.5x with a forward P/E-to-Growth ratio (PEG) of 1.59x, and the S&P 500 () is at 22.3x and 1.65x, as of 10/7. But looking beyond cap-weighted, broad market indexes we find more palatable valuations, with the equal-weight Nasdaq 100 (QQQE) at a forward P/E of 23.3x and forward PEG of 1.52x, and the equal-weight S&P 500 () at 17.6x and 1.68x. The lower the forward P/E and PEG, the better, so while the forward PEG ratios for the equal-weight indexes are about the same as their more popular cap-weight versions, the forward P/Es for the equal weights are much more attractive.On the other hand, small caps surged in July but have pulled back of late. Indeed, over 40% of the Russell 2000 Index are unprofitable with high debt loads. But when you look at the subset of fundamentally sound small caps, they appear to be an undervalued asset class. For example, the quality-oriented S&P 600 SmallCap (), which requires consistent profitability for index eligibility, has a forward P/E of just 15.2x while the zombie-laden Russell 2000 () is at 16.5x.Let’s look for a moment at Europe and China as two other potential places to invest. The EURO STOXX 50 equity price index (excluding dividends) for the Eurozone is only slightly above where it was in 2007, right before the Global Financial Crisis, so it’s actually -30% lower in real terms (net after subtracting inflation). Chinese stock prices are -67% lower in real terms from their 2007 highs. Meanwhile, the S&P 500 price index is +60% higher in real terms over the same timeframe.As Eric Peters of One River Asset Management has observed, “As a general observation, the US invents, China builds, the EU regulates. And the stock market does an admirable job at indicating which of those activities you [should] want to prioritize… The divergence [in their respective GDP growth rates] is utterly staggering. And now, of the globe’s top 25 largest companies, just one is European… It’s a healthy reminder for Americans, as we enter our political season, to stay true to our system and to that which has led to our greatness. Innovation, invention, risk taking, entrepreneurialism.” Keep in mind, taxing capital gains at a much lower rate than regular income has helped to fuel our entrepreneurial culture.So, it appears Europe is spiraling into irrelevance and perhaps ultimately an economic depression given its increasingly socialist welfare statehood. And for its part, China’s mix of communism and “capitalism with Chinese characteristics” has long been an overleveraged “house of cards,” as I have discussed many times in prior posts. More thoughts from Eric Peters: “Europe’s approach is failing. China’s is too… Beijing runs its economy to create jobs and allow insiders to extract money which they move offshore. Maybe that will change someday, although it’s doubtful [and would] require a wholesale change in economic and political philosophy. There are no signs of that kind of game changer on the horizon. Capital owners lose in China.”
GDP and Inflation:The BEA has reported US GDP for Q1 at +1.6% and Q2 at +3.0% (although it has been largely supported by government spending, and a former OMB chief economist calculated that productive private sector growth was only +1.3%). Looking ahead, the first estimate for Q3 by the BEA will be released on 10/30, but the latest Atlanta Fed GDPNow forecast for Q3 is predicting +3.2% (as of 10/8).As for inflation, this week will reveal September CPI and PPI reports on 10/10-11, Personal Consumption Expenditures (PCE), aka Consumer Spending, for September comes out 10/31, and then the next FOMC policy announcement is on 11/7—right after 11/5 election day. For now, let’s compare the various August readings.In the graphic below, the upper chart compares the year-over-year (YoY) trends in PPI, CPI, Core CPI, and Core PCE (“core” excludes the volatile food & energy components), along with the “Harmonized” HICP (an alternative European methodology described below). The downtrends are obvious, with HICP notably at just +1.32%. In addition, real-time, blockchain-based “Truflation,” which is updated daily and historically presages CPI by several months, also has held below the Fed’s 2% target.In the lower chart, I show annualized 3-month rolling averages to better reflect current inflation trends (without the effects of the large first-of-year resets on many services costs. All these annualized 3-month metrics show current inflation at or below the Fed’s 2% target, with PPI at +1.70%, CPI at +1.15%, Core CPI at +2.06%, Core PCE also at +2.06%, and HICP at just +1.10%.
The HICP is a European method of accounting for inflation across countries in the EU (thus the “harmonized” adjective). As such, it was designed to facilitate international comparisons of consumer price inflation. The U.S. Bureau of Labor Statistics (BLS, in the Department of Labor) began calculating a US version of the index as a research project in 2006. Compared to CPI, there are two main differences. First, HICP includes rural populations while CPI focuses solely on urban areas, and second, HICP excludes the fictitious concept of owners’ equivalent rent (OER) and replaces it with the true cost of owner-occupied housing (e.g., price of home acquisition, repairs, and improvements).The chart below shows the historical 10- minus 2-year Treasury yield spread, which until recently has been technically inverted for a good stretch of time (falling to -1.06 pps in June 2023, the lowest since 1981), and its recent “un-inversion” suggests to many analysts and economists that this (from a historical perspective) predicts an imminent recession. However, as I have discussed before, economist Michael Howell of CrossBorder Capital makes a compelling counterargument that, because the Treasury market is manipulated by overwhelming issuances on the short end of the curve, the longer end has a shortage of supply (which artificially pushes yields lower), but if you look at the similarly risk-free agency mortgage-backed securities (MBS) market (issed by agencies of the federal government, so essentially guaranteed by it), his adjusted yield for a theoretical 10-year agency MBS has been consistently above the 2-year Treasury yield—suggesting that perhaps there has been no actual market-based inversion of the yield curve and thus no recession.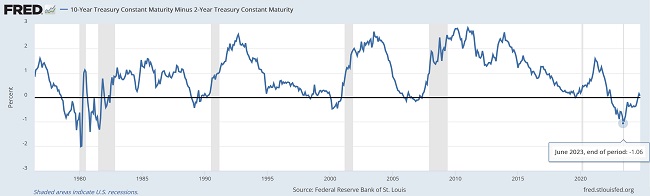
Final ThoughtsAgain, I believe any market correction this quarter should be considered a buying opportunity for long-term investors. This presumes that the proverbial “Fed Put” is indeed back in play, i.e., a willingness to intervene to support markets (like a protective put option) through asset purchases to reduce interest rates and inject liquidity (aka quantitative easing). The Fed Put also serves to reduce bond credit spreads and term premiums as investors are more willing to hold lower-quality and longer-duration securities. And as for the Fed’s interest rate policy, I continue to believe that rate normalization means ultimately taking fed funds down to a terminal rate of about 3.0-3.5%—as quickly as prudent.As for the election, let me add this. With the weeks-long voting process underway, both presidential candidates offer starkly different views not only on taxation, regulation, and spending, but on whether our constitutional rights are absolute/God-given or merely “privileges” that an all-knowing, benevolent government should closely control for the “common good.” These include freedom of speech, parental rights, gun ownership, due process, unreasonable search & seizure, speedy public trial, and national/border security—not to mention the rule of law, meritocracy, and discrimination in the age of DEI, and whether to “pack” the Supreme Court (with activist judges willing to “legislate from the bench” when Congress won’t do the “right thing”), kill the filibuster, and bestow Puerto Rico and Washington D.C. with statehood to prevent the “other side” from ever winning again—because if it ever did, it could mean the end of our country and democracy. Give me a break. Total gaslight.Let’s all take a deep breath and try to think clearly. In his famous book, 7 Habits of Highly Effective People, Stephen Covey listed as #5 this admonition: “Seek first to understand, then to be understood.” I really love this gem as essential behavior, not just for a highly effective person, but for a fully functional society. And yet it is so rarely practiced in today’s divided, echo-chamber, sound-bite culture. So, to clarify the two sides at their core, the main difference in my view between a “conservative” and a “liberal” is simply that a conservative believes the US Constitution should be interpreted as written, while a liberal believes the Constitution should be interpreted more loosely to accommodate the evolving needs and trends of modern society. There are things to be learned from both sides, if we just take time to listen with an open mind. But too many idealistic minds today prefer to shout down or cancel alternative viewpoints rather than seek to understand them.To a large segment of society, a caring, empathetic, feminine approach (as opposed to traditional “toxic masculinity”) to governance through “nanny state” socialist practices and clamping down on our constitutional rights like freedom of speech and the right to bear arms is essential for safety and harmony. But to others, giving up any of our God-given rights enshrined in the Constitution is a slippery slope toward socialist authoritarianism and rejection of our longstanding moral compass.For example, when faced with a difficult family situation—like a child suffering from addiction, for instance—most parents wouldn’t bring drugs and clean needles to the child’s bedroom each day to enable the destructive behavior. No, most would intervene decisively and force rehab, even if confronted with strong resistance, to prioritize long-term wellbeing over momentary comfort. Similarly, government policies that enable harmful behavior in the short run in the name of empathy, such as clean needle distribution or no-cash bail or open borders, only exacerbate societal problems in the long run. The rise in crime, drug overdoses, and human trafficking and the overwhelming influx of destitute migrants into our already overburdened inner cities is evidence that this permissive approach fails to protect our poorest and most vulnerable communities. Instead, the enforcement of boundaries and punishment of bad behavior creates a safer, more prosperous society, just as it makes a more stable, happy, and prosperous family in the home.Examples can be found in Rudy Giuliani (followed by Michael Bloomberg) transforming New York City from crime-ridden to safe and clean (before lenient policies reemerged to set it back once again), or leaders today like Nayib Bukele in El Salvador and Javier Milei in Argentina turning around their failing countries. Each illustrates that a tough, no-nonsense approach can create peace, stability, safety, cleanliness, happiness, and prosperity. To my mind, true compassion means protecting the innocent and ensuring the safety of all citizens, particularly the downtrodden who suffer the most from unchecked crime and immigration. Rather than enabling (or often incentivizing) bad behavior, we must insist upon accountability, law and order, meritocracy, and respect for all citizens—values that are crucial for the long-term health of any community or nation.Moreover, if a candidate promises to enact policies and entitlements that can’t possibly pass a divided Congress, or if they insist that higher taxes on corporations and billionaires will magically resolve the budget deficit and reduce our spiraling debt in the long run, then they are either delusional or lying. And if you are a single-issue voter while the rest of your candidate’s slate of policies go against your best interests, or if you simply don’t like one candidate’s personality even though you generally support their policies, then perhaps you are too controlled by your emotions.Democrats have held the presidency for 12 of the past 16 years since we emerged from the Financial Crisis, so all these problems with the economy, inflation, debt, immigration, inner city decay, homelessness, societal division, and multiple wars that Harris promises she will fix came about under their watch—with Trump’s 4 short years the most peaceful and prosperous of all. (Note: In fairness, the 8 years under Bill Clinton, 1992-2000, were also peaceful and prosperous, which demonstrates that Democrats can show good governance when they aren’t so focused on destructive/divisive woke ideology.) Furthermore, Harris seems to be running on a vacuous 4-prong platform of: 1) I was born into the middle class, 2) corporations and billionaires must pay their “fair share,” 3) abortion should be unrestricted, and 4) Trump is bad. So, I implore you, dear reader, to take a deep breath, clear your mind of unhealthy emotions, and vote with your head not your heart.Lastly, regarding the escalating Middle East conflict, of course the continued destruction of Gaza and its rising civilian death toll is outrageous and upsetting. But I don’t place the blame on Israel at all. After all, the first priority of any government is to protect its people, which Israel is doing vigorously, while Hamas deliberately martyrs its own people as human shields and cannon fodder in a soulless effort to gain international sympathy (which is, in its perception, Western weakness). In this warped ideology, the individual matters little; all that matters is the movement, the agenda, the eternal pursuit of a global Islamic Caliphate unfettered by Jews and other “infidels.” That’s what is meant by the slogan, “From the river to the sea, Palestine shall be free.”The war would be over tomorrow if Hamas would simply surrender, release the hostages, agree to a peaceful 2-state coexistence, and then enjoy the generosity and goodwill of the civilized world to rebuild Gaza (in a modern “Marshall Plan”) and provide a prosperous future for the Palestinian people as productive members of a diverse global community. But unlike free and tolerant Israel, where anyone is welcome to worship as they please, a 2-state solution is not an acceptable outcome for Radical Islamists like Hamas and Hezbollah (and their sycophants here in the US, Iran, and elsewhere). They refuse to coexist with Jews or any other faiths. Their blind intolerance is the entire problem…and is leading to their undoing.
Latest Sector RankingsRelative sector rankings are based on Sabrient’s proprietary SectorCast model, which builds a composite profile of each of over 1,400 equity ETFs based on bottom-up aggregate scoring of the constituent stocks. The Outlook Score is a Growth at a Reasonable Price (GARP) model that employs a forward-looking, fundamentals-based multifactor algorithm considering forward valuation, historical and projected earnings growth, the dynamics of Wall Street analysts’ consensus earnings estimates and recent revisions (up or down), quality and sustainability of reported earnings, and various return ratios. It helps us predict relative performance over the next 3-6 months.In addition, SectorCast computes a Bull Score and Bear Score for each ETF based on recent price behavior of the constituent stocks on particularly strong and weak market days. A high Bull score indicates that stocks within the ETF recently have tended toward relative outperformance when the market is strong, while a high Bear score indicates that stocks within the ETF have tended to hold up relatively well (i.e., safe havens) when the market is weak. Outlook score is forward-looking while Bull and Bear are backward-looking.As a group, these three scores can be helpful for positioning a portfolio for a given set of anticipated market conditions. Of course, each ETF holds a unique portfolio of stocks and position weights, so the sectors represented will score differently depending upon which set of ETFs is used. We use the iShares that represent the ten major U.S. business sectors: Financials (IYF), Technology (IYW), Industrials (IYJ), Healthcare (IYH), Consumer Staples (IYK), Consumer Discretionary (IYC), Energy (IYE), Basic Materials (IYM), Telecommunications (IYZ), and Utilities (IDU). Whereas the Select Sector SPDRs only contain stocks from the S&P 500 large cap index, I prefer the iShares for their larger universe and broader diversity.The table below shows the latest fundamentals-based Outlook rankings and my full sector rotation model. I would call the rankings neutral given that secular growth, cyclicals, and defensives are mixed throughout. Bullish rankings would entail cyclical and economically sensitive sectors dominating the top half of the rankings with scores well above 50 and defensive sectors in the lower half. In the immediate wake of the Fed rate cut and dovish pivot, the rankings were more bullish, but with the market’s renewed strength and broad reductions to earnings estimates, valuation multiples are back to extremes once again as prices have gotten ahead of earnings growth forecasts but boosted by lower interest rates.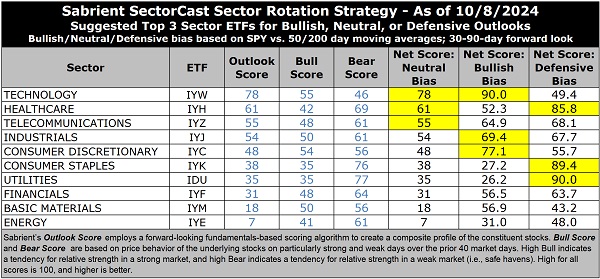
Although down from its lofty Outlook Score (in the 90s), Technology (dominated by the mega-cap MAG-7) remains well above all other sectors with an Outlook score of 78, despite having by far the highest forward P/E (28.8x). However, because of its strong EPS growth estimates (18.2%), its forward PEG (P/E to EPS growth ratio) is a relatively modest 1.59, which is second lowest only to Financials’ 1.17. Tech also displays the best analyst earnings revisions, the highest return ratios, and the most insider buying. Rounding out the top 6 are Healthcare, Telecom, Industrials, Consumer Discretionary, and Consumer Staples. Notably, 8 of the 10 sectors have seen net negative revisions to EPS estimates, with only Tech and Utilities slightly positive.Notably, Telecom, Financials, and Energy display the lowest forward P/Es at 14.0x, 14.5x and 14.8x, respectively. At the bottom of the rankings are Energy and Materials, mainly due to large negative revisions to earnings estimates, low projected EPS growth rates, poor return ratios, and high PEG ratios.Keep in mind, the Outlook Rank does not include timing, momentum, or relative strength factors, but rather reflects the consensus fundamental expectations at a given point in time for individual stocks, aggregated by sector.
Sector Rotation Model and Other ETF Trading IdeasOur rules-based Sector Rotation model, which appropriately weights Outlook, Bull, and Bear scores in accordance with the overall market’s prevailing trend (bullish, neutral, or defensive), flipped back to a bullish bias on 9/12 (based on the SPY close firmly above its 50-day moving average and also remaining above the 200-day). (Note: In this model, we consider the bias to be bullish from a rules-based trend-following standpoint when SPY is above both its 50-day and 200-day simple moving averages, but neutral if it is between those SMAs while searching for direction, and defensive if below both SMAs.)Thus, it suggests holding Technology (IYW), Consumer Discretionary (IYC), and Industrials (IYJ), in that order. However, if you prefer a neutral stance, the Sector Rotation model suggests holding Technology, Healthcare (IYH), and Telecom (IYZ), in that order. Or, if you prefer to take a defensive stance on the market (given lofty valuations and the potential for more pre-election downside), it suggests holding Utilities (IDU), Consumer Staples (IYK), and Healthcare, in that order.An assortment of other interesting ETFs that are scoring well in our latest rankings include: iShares MSCI Global Gold Minder (RING), Global X Social Media (SOCL), ERShares Private-Public Crossover (XOVR), US Global GO GOLD and Precious Metal Miners (GOAU), Invesco Dorsey Wright Technology Momentum (PTF), Pacer US Large Cap Cash Cows Growth Leaders (COWG), Invesco Next Gen Media and Gaming (GGME), American Century Focused Dynamic Growth (FDG), ProShares Metaverse (VERS), First Trust Active Factor Small Cap (AFSM), Alerian MLP (AMLP), American Century US Quality Growth (QGRO), PGIM Jennison Better Future (PJBF), SP Funds S&P World ex-US (SPWO), Trenchless Fund (RVER), VanEck Junior Gold Miners (GDXJ), Fidelity Disruptive Communications (FDCF), WealthTrust DBS Long Term Growth (WLTG), iShares US Pharmaceuticals (IHE), GraniteShares Nasdaq Select Disruptors (DRUP), First Trust Innovation Leaders (ILDR), Counterpoint Quantitative Equity (CPAI), Horizon Kinetics Medical (MEDX), Alger 35 (ATFV), ETC 6 Meridian Small Cap Equity (SIXS), and EMQQ Emerging Markets Internet (EMQQ). All score in the top decile (90-100) of Outlook scores.More By This Author:
Is The September Surge In Jobs And Consumer Spending Reality Or More Manipulation?

