The good news is:
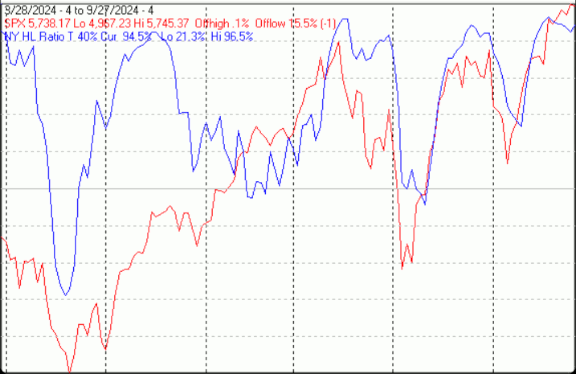
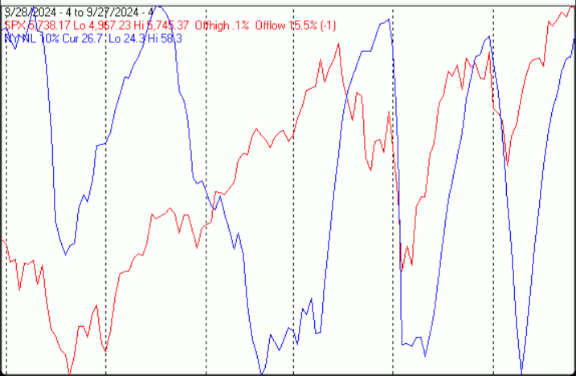
The NegativesNegatives are difficult to find. The PositivesThe first chart covers the last 6 months showing the Nasdaq composite (OTC) in blue and a 10% trend (19 day EMA) of Nasdaq new highs (OTC NH) in green. Dashed vertical lines have been drawn on the 1st trading day of each month. OTC NH continued to lead prices upward last week. 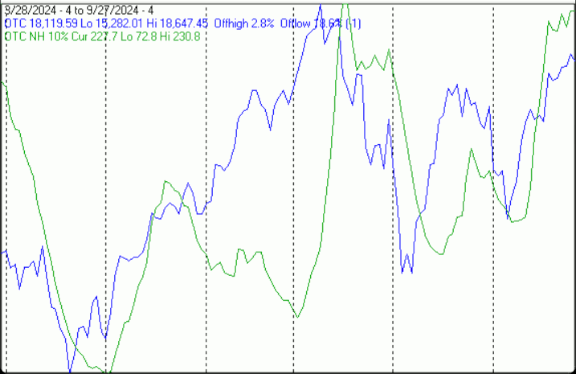
SeasonalityNext week includes the last trading day of September and the 1st 4 trading days of October during the 4th year of the Presidential Cycle. The tables below show the daily change, on a percentage basis for that period. OTC data covers the period from 1963 to 2023 while SPX data runs from 1928 to 2023. There are summaries for both the 4th year of the Presidential Cycle and all years combined. Average returns for the coming week have been mixed and weaker during the 4th year of the Presidential Cycle than other years, Report for the last day of September and first 4 days of October.The number following the year represents its position in the Presidential Cycle.The number following the daily return represents the day of the week;1 = Monday, 2 = Tuesday etc. OTC Presidential Year 4 (PY4) Day1 Day1 Day2 Day3 Day4 Totals 1964-4 0.26% 3 0.09% 4 -0.25% 5 0.07% 1 0.19% 2 0.35% 1968-4 -0.04% 1 0.20% 2 0.61% 4 0.37% 5 -0.12% 1 1.02% 1972-4 0.37% 5 -0.24% 1 0.14% 2 -0.15% 3 -0.99% 4 -0.87% 1976-4 -0.01% 4 -0.90% 5 0.02% 1 -0.78% 2 -0.80% 3 -2.47% 1980-4 1.06% 2 0.99% 3 0.63% 4 1.37% 5 1.33% 1 5.39% Avg 0.33% 0.03% 0.23% 0.18% -0.08% 0.68% 1984-4 -0.14% 5 -0.83% 1 -0.71% 2 -0.52% 3 0.16% 4 -2.05% 1988-4 0.43% 5 -0.83% 1 -0.07% 2 0.08% 3 0.16% 4 -0.23% 1992-4 0.98% 3 -0.85% 4 -1.16% 5 -1.12% 1 0.94% 2 -1.21% 1996-4 -0.26% 1 -0.44% 2 1.20% 3 -0.23% 4 1.17% 5 1.43% 2000-4 -2.79% 5 -2.83% 1 -3.17% 2 1.95% 3 -1.45% 4 -8.29% Avg -0.36% -1.16% -0.78% 0.03% 0.20% -2.07% 2004-4 0.15% 4 2.39% 5 0.53% 1 0.16% 2 0.79% 3 4.02% 2008-4 4.97% 2 -0.62% 3 -4.48% 4 -1.48% 5 -4.34% 1 -5.95% 2012-4 -0.65% 5 -0.09% 1 0.21% 2 0.49% 3 0.45% 4 0.41% 2016-4 0.81% 5 -0.21% 1 -0.21% 2 0.50% 3 -0.17% 4 0.72% 2020-4 0.74% 3 1.42% 4 -2.22% 5 2.32% 1 -1.57% 2 0.70% Avg 1.21% 0.58% -1.24% 0.40% -0.97% -0.02% OTC summary for PY4 1964 – 2020Averages 0.39% -0.18% -0.60% 0.20% -0.28% -0.47%% Winners 60% 33% 47% 60% 53% 53%MDD 10/6/2008 10.53% — 10/3/2000 8.54% — 10/5/1992 3.10% OTC summary for all years 1963 – 2023Averages -0.02% -0.02% -0.10% 0.27% 0.04% 0.17%% Winners 49% 53% 52% 64% 59% 62%MDD 10/6/1998 12.87% — 10/6/2008 10.53% — 10/3/2000 8.54%
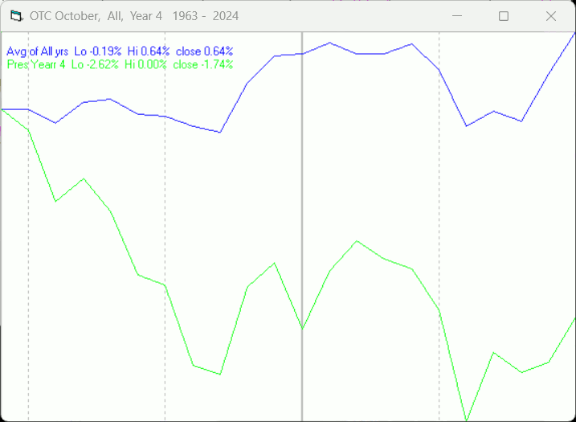
SPX PY4 Day1 Day1 Day2 Day3 Day4 Totals 1928-4 1.09% 6 -0.05% 1 -0.47% 2 -0.33% 3 0.33% 4 0.57% 1932-4 -0.25% 5 0.87% 6 -1.10% 1 -0.12% 2 -8.20% 3 -8.81% 1936-4 -0.31% 3 0.19% 4 1.93% 5 0.98% 6 0.12% 1 2.91% 1940-4 0.09% 1 1.41% 2 0.46% 3 0.09% 4 -0.83% 5 1.23% 1944-4 0.31% 6 0.16% 1 0.00% 2 0.55% 3 0.62% 4 1.64% 1948-4 -0.39% 4 1.16% 5 0.51% 6 0.63% 1 -0.19% 2 1.73% 1952-4 -0.57% 2 -0.24% 3 0.16% 4 -0.08% 5 -0.24% 1 -0.97% 1956-4 -0.55% 5 -1.43% 1 1.83% 2 1.67% 3 0.02% 4 1.54% 1960-4 1.71% 5 -0.30% 1 -0.69% 2 0.75% 3 0.62% 4 2.09% Avg 0.10% -0.13% 0.36% 0.70% 0.17% 1.21% 1964-4 -0.07% 3 -0.12% 4 0.33% 5 0.45% 1 0.06% 2 0.65% 1968-4 0.35% 1 0.19% 2 0.47% 4 0.36% 5 -0.01% 1 1.35% 1972-4 0.18% 5 -0.35% 1 0.13% 2 -0.19% 3 -1.09% 4 -1.32% 1976-4 -0.12% 4 -1.02% 5 -0.13% 1 -0.77% 2 -0.25% 3 -2.30% 1980-4 1.55% 2 1.33% 3 0.76% 4 0.97% 5 1.86% 1 6.46% Avg 0.38% 0.01% 0.31% 0.16% 0.11% 0.97% 1984-4 -0.52% 5 -0.89% 1 -0.63% 2 -0.70% 3 0.30% 4 -2.44% 1988-4 -0.25% 5 -0.19% 1 -0.28% 2 0.46% 3 0.19% 4 -0.07% 1992-4 0.24% 3 -0.36% 4 -1.40% 5 -0.71% 1 -0.10% 2 -2.32% 1996-4 0.17% 1 0.26% 2 0.71% 3 -0.18% 4 1.25% 5 2.21% 2000-4 -1.49% 5 -0.02% 1 -0.68% 2 0.55% 3 0.14% 4 -1.51% Avg -0.37% -0.24% -0.45% -0.12% 0.36% -0.82% 2004-4 -0.02% 4 1.52% 5 0.32% 1 -0.06% 2 0.67% 3 2.43% 2008-4 5.27% 2 -0.32% 3 -4.03% 4 -1.35% 5 -3.85% 1 -4.27% 2012-4 -0.45% 5 0.27% 1 0.09% 2 0.36% 3 0.72% 4 0.98% 2016-4 0.80% 5 -0.33% 1 -0.50% 2 0.43% 3 0.05% 4 0.45% 2020-4 0.83% 3 0.53% 4 -0.96% 5 1.80% 1 -1.40% 2 0.80% Avg 1.29% 0.33% -1.01% 0.24% -0.76% 0.08% SPX summary for PY4 1928 – 2020Averages 0.32% 0.09% -0.13% 0.23% -0.38% 0.13%% Winners 50% 46% 50% 58% 58% 63%MDD 10/5/1932 9.33% — 10/6/2008 9.26% — 10/3/1984 2.71% SPX summary for all years 1928 – 2023Averages -0.02% 0.09% 0.13% 0.23% -0.13% 0.29%% Winners 45% 52% 63% 57% 54% 60%MDD 10/5/1931 12.33% — 10/5/1932 9.33% — 10/6/2008 9.26% OctoberSince 1963, over all years, the OTC in October has been up 56% of the time with an average gain of 0.9% During the 4th year of the Presidential Cycle October has been up 33% time with an average loss of -1.9 (helped considerably by a 17.4% loss in 2008). The best October ever for the OTC was 1974 (+17.2%), the worst 1987 (-27.2%).The average month has 21 trading days. The chart below has been calculated by averaging the daily percentage change of the OTC for each of the 1st 11 trading days and each of the last 10. In months when there were more than 21 trading days some of the days in the middle were not counted. In months when there were less than 21 trading days some of the days in the middle of the month were counted twice. Dashed vertical lines have been drawn after the 1st trading day and at 5 trading day intervals after that. The line is solid on the 11th trading day, the dividing point.In the chart below the blue line shows the average of the OTC in October over all years since 1963 while the green line shows the average during the 4th year of the Presidential Cycle over the same period.