In the past few years, a persistently low level of consumer sentiment, as measured by the University of Michigan, Conference Board, or Gallup surveys, relative to conventional economic measures has puzzled analysts, including this one . This puzzle is illustrated by the evolution of the U. Michigan series (FRED series UMCSENT), and the fitted values using 2011M01-2024M08 data on unemployment and year-on-year inflation.(Click on image to enlarge)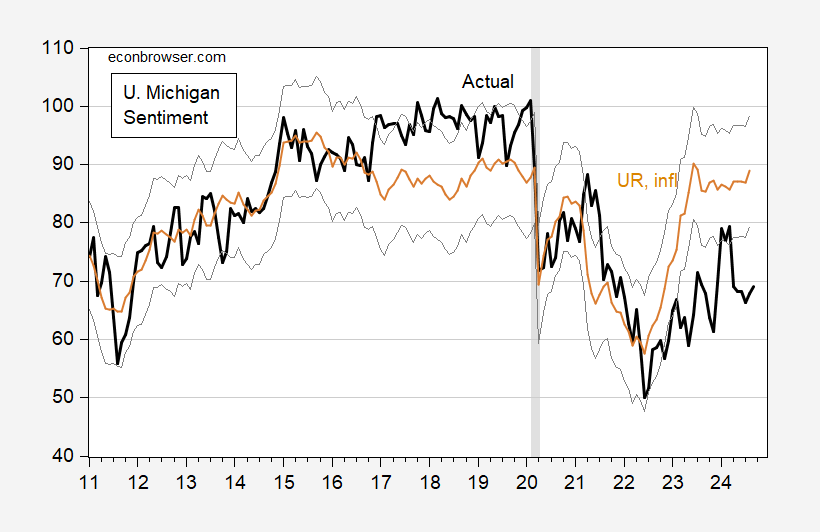 Figure 1: University of Michigan Consumer Sentiment index (bold black), fitted values using unemployment and inflation (see text) (tan), +/- 1 standard error band (gray line). NBER defined peak-to-trough recession dates shaded gray. Source: University of Michigan via FRED, NBER, and author’s calculations.
Here’s the regression results (where inflation is 12 month growth rate, in %):UMCSENT = 104.12 –2.455 UNRATE – 3.727 INFLAdj-R2 = 0.51, SER 9.256, DW = 0.23, N=164, Sample 2011M01-2024M08. Bold denotes significance at 10% level using HAC Newey-West standard errors.Peak gap is in mid-2023 and end-2023.Partial resolution is shown in the following picture, motivated by .(Click on image to enlarge)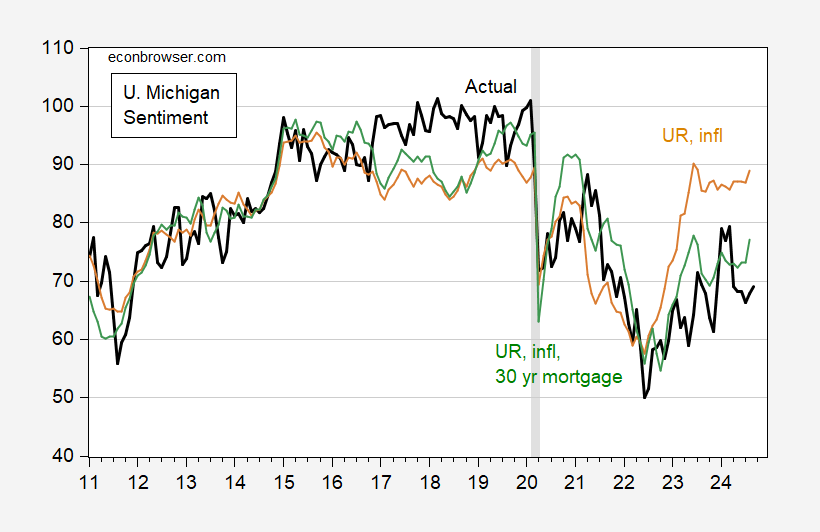 Figure 2: University of Michigan Consumer Sentiment index (bold black), fitted values using unemployment and inflation(tan), using unemployment, inflation, and 30 year mortgage rate (green). NBER defined peak-to-trough recession dates shaded gray. Source: University of Michigan via FRED, NBER, and author’s calculations.
The green line is the fit using the baseline equation augmented with 30 year mortgage rates.UMCSENT = 135.67 –3.669 UNRATE – 3.328 INFL – 5.97 MORTGAGE30USAdj-R2 = 0.73, SER 6.785, DW = 0.48, N=164, Sample 2011M01-2024M08. Bold denotes significance at 10% level using HAC Newey-West standard errors.Where MORTGAGE30US is the FRED series for the 30 year mortgage rate in the US. Note that in both regressions, I’ve used HICP (which does not include housing costs) as my price index.The mortgage rate is almost as important as the unemployment rate, according to standardized (beta) coefficients (0.53 vs. 0.58, and 0.62 for inflation).These results indicate that a 1.1 percentage point decline in MORTGAGE30US since the October 2023 peak (thru August) has accounted for an approximately 6.5 point increase in UMCSENT.Similar results are exhibited by the Conference Board’s Consumer Confidence index (although HICP y/y inflation doesn’t show up as statistically significant):(Click on image to enlarge)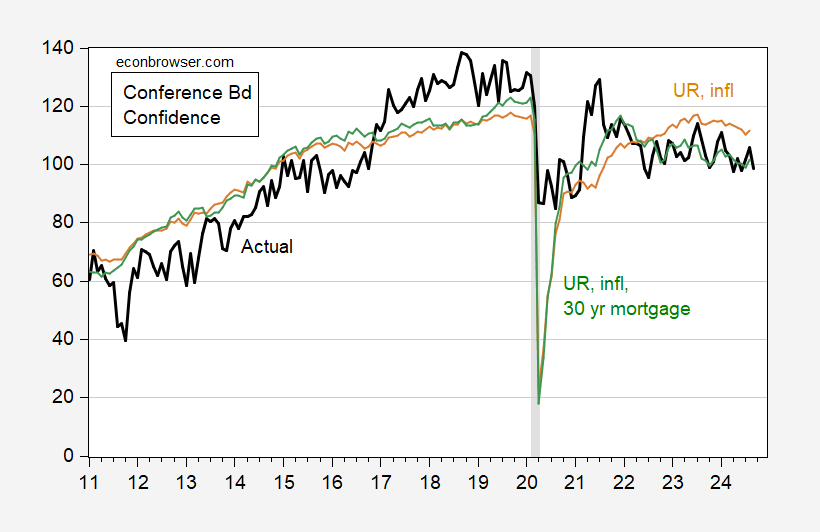 Figure 3: Conference Board Consumer Confidence Index index (bold black), fitted values using unemployment and inflation (tan), using unemployment, inflation, and 30 year mortgage rate (green). NBER defined peak-to-trough recession dates shaded gray. Source: Conference Board via Investing.com, NBER, and author’s calculations.
The regression results are:CONFIDENCE_CONFBD = 175.28 –9.544 UNRATE – 0.716 INFL – 4.984 MORTGAGE30USAdj-R2 = 0.63, SER 13.640, DW = 0.40, N=164, Sample 2011M01-2024M08. Bold denotes significance at 10% level using HAC Newey-West standard errors.Why is this only a possible resolution? If one extends the sample before 2011M01, the regression results fall apart. Inclusion of MORTGAGE30US then yields a positive coefficient, insignificant at first, and significant as the sample extends further back in time (see e.g. 1991M01-2024M08; one can use CPI ex-shelter as a longer series for prices). Since this instability in the relationship is not associated with the change in including housing costs in the CPI as noted by , I think of this as a remaining puzzle. Perhaps if housing prices were also included, this would remedy the problem (actually, I have checked – it kind of does).Finally, note that mortgage rates enter asymmetrically into UMCSENT for Democrats vs. Republicans. Mortgage rates have an insignificant impact for Democrats’ sentiment. A Trump dummy dominates for both Republicans and Democrats, in terms of influence as measured by a standardized coefficient. Hence, the inclusion of mortgage rates do not explain all the seemingly anomalous behavior of sentiment indices.More By This Author:
The Low Consumer Sentiment/Confidence Puzzle Resolved?

