↵
As Bitcoin price valuation inches closer to the $65,000 mark, the asset has grabbed the attention of market analysts, with one recently highlighting a key indicator that now suggests a potential further recovery in BTC’s price.Particularly, according to a recent on the CryptoQuant Quicktake platform by an analyst under the pseudonym ‘Darkfost,’ the Bitcoin Stock-to-Flow (S2F) reversion chart is now showing a major buy signal for Bitcoin.
S2F Signal Prime Buy Opportunity
The S2F model is widely used to forecast Bitcoin’s price by measuring its scarcity. It indicates whether the market is leaning towards a buy or sell zone based on its supply rate.Darkfost explained that the S2F reversion chart is now signalling a , with the SF ratio dipping below 1, which represents a green zone.(Click on image to enlarge)
This zone suggests that Bitcoin may be undervalued compared to its historical trend, making it a potential time to accumulate BTC.The analyst elaborated that the last time Bitcoin entered this buy zone was in June and September of 2023, followed by .Investors who had taken positions during these periods saw favorable returns as Bitcoin’s price rallied in the following months.Notably, the S2F model’s predictive nature has often been a major tool for traders looking to capitalize on long-term Bitcoin trends. Asides its movement below 1, when the SF ratio climbs above 1, it signals a red zone, or profit-taking opportunity.
Bitcoin Price Action And Key Technical Levels
In addition to the S2F signal, Bitcoin’s price action in the past few days has also resulted from recent macroeconomic events, particularly the .Following the rate reduction by 50 basis points on Wednesday, Bitcoin in the early hours of today, marking a significant rally given the asset has been in a bearish and accumulation phase prior.However, as of now, the cryptocurrency has retraced slightly from its 24-hour high above $64,000 and is trading at $63,036, down by a mere 0.1% over the past day.(Click on image to enlarge)
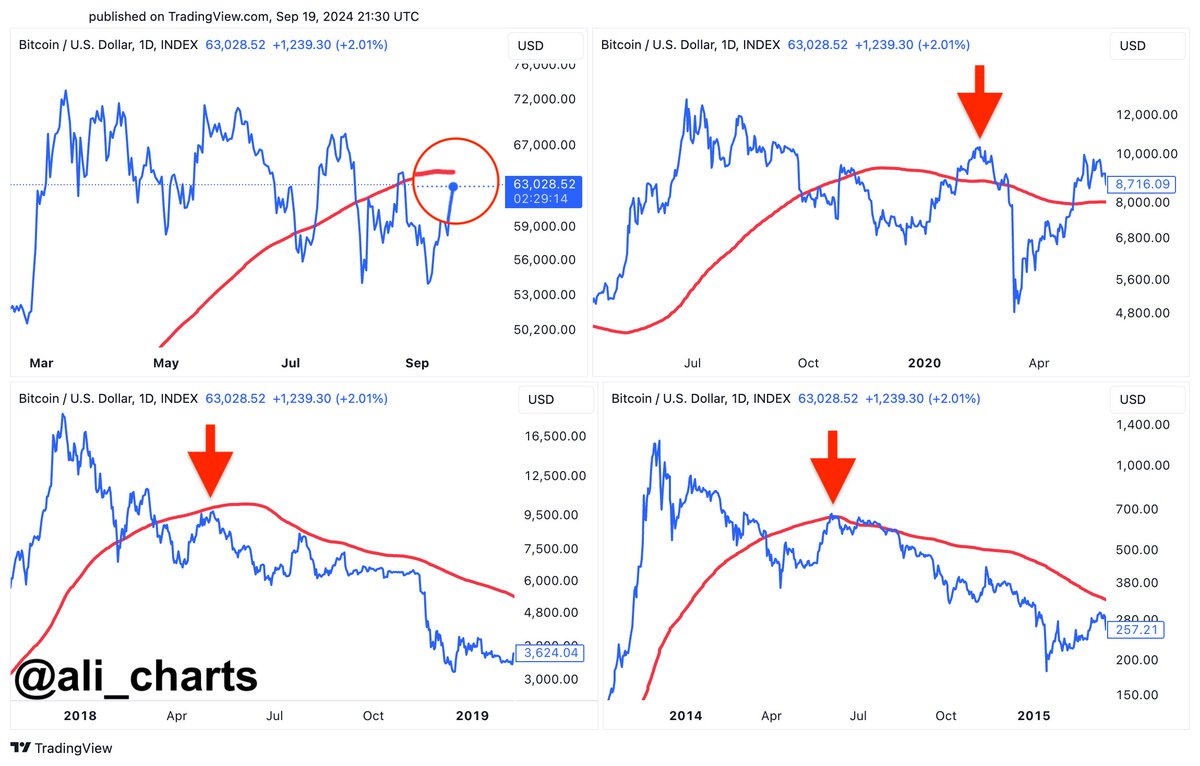
Meanwhile, despite the S2F reversion chart pointing to a potential buying opportunity, another crypto analyst, Ali, has raised concerns about Bitcoin’s near-term future.In a recent on X, Ali highlighted Bitcoin’s current position relative to its 200-day Simple Moving Average (SMA), a critical indicator for determining the strength of a market trend. Bitcoin is currently testing this level, which historically has been an essential factor in confirming a bull run.(Click on image to enlarge)
Ali noted that previous failures to reclaim the 200-day SMA, as seen in 2020, 2018, and 2014, led to significant price corrections. If Bitcoin fails to hold above this level in the coming days, it could signal a broader market downturn.However, if it maintains support, Bitcoin could continue its upward trajectory, setting the stage for .More By This Author:Bitcoin Demand Surge: Binance Buyers Take Charge As Coinbase Premium FallsNeiro Price Prediction – Is First Neiro On Ethereum The Next Dogecoin? Bitcoin To Follow U.S. Stock Market All-Time High
Bitcoin Approaches $65,000: Is Now The Perfect Time To Buy?