
The federal government’s fiscal year ends on September 30, and with it, a budget extension is needed to keep the government running beyond that date. Accordingly, as seems to be the norm, government dysfunction is back on full display. House Speaker Mike Johnson failed to pass a budget extension bill on Wednesday. Moreover, he doesn’t appear to have a plan B. While the threat of a minor shutdown is real, history has proven a high likelihood that a deal will be struck and a short-term patch will buy a month or two of funding before another round of government dysfunction rears its head.From an investor’s perspective, there are two potential impacts if government dysfunction rules the day and the government shuts down for a short period. The first is political. With the Republican-led House unable to pass a continuation bill, Democrats may blame the Republicans for the shutdown. Given that the election appears very close, it may not take much to sway the results. The differences in corporate tax proposals between Trump and Harris could impact the stock market; therefore, shifting votes one way or another could be significant. Second, if the government shuts down, there will be temporary layoffs, which would worsen employment data. While temporary, an increase in the unemployment rate could make the markets anxious. Moreover, it could push the Fed to be more aggressive with rate cuts as it’s now clear they are concerned about the weakening labor markets.(Click on image to enlarge) What To Watch Today Earnings
Economy
Market Trading Update focused on the Fed rate cut and the potential market response. While the bullish backdrop persists and continued yesterday, the negative relative strength and momentum divergences suggest some caution. One notable outlier yesterday was bonds. We discussed earlier this week that Treasury bonds were extremely overbought and needed to be corrected. Furthermore, since they had run up sharply into the Fed meeting, a “buy the rumor, sell the news” event was likely. Such seems to be the case, with bonds selling off decently over the last two days.Yesterday, Treasury bonds (using TLT as a proxy) broke through the 20-DMA. The next level of support is the 50-DMA, at 97, with crucial support at the 100- and 200-DMA, both of which are at 94. With the MACD just turning onto a “sell signal,” the current correction in bond prices could continue for a few days. However, that is a welcome opportunity for us to rebalance our bond portfolio duration and add bonds to our holdings as needed.In the long term, as the Fed continues to cut rates, bonds should not only continue to perform, but history suggests they tend to outperform stocks as a whole. Trade accordingly.(Click on image to enlarge)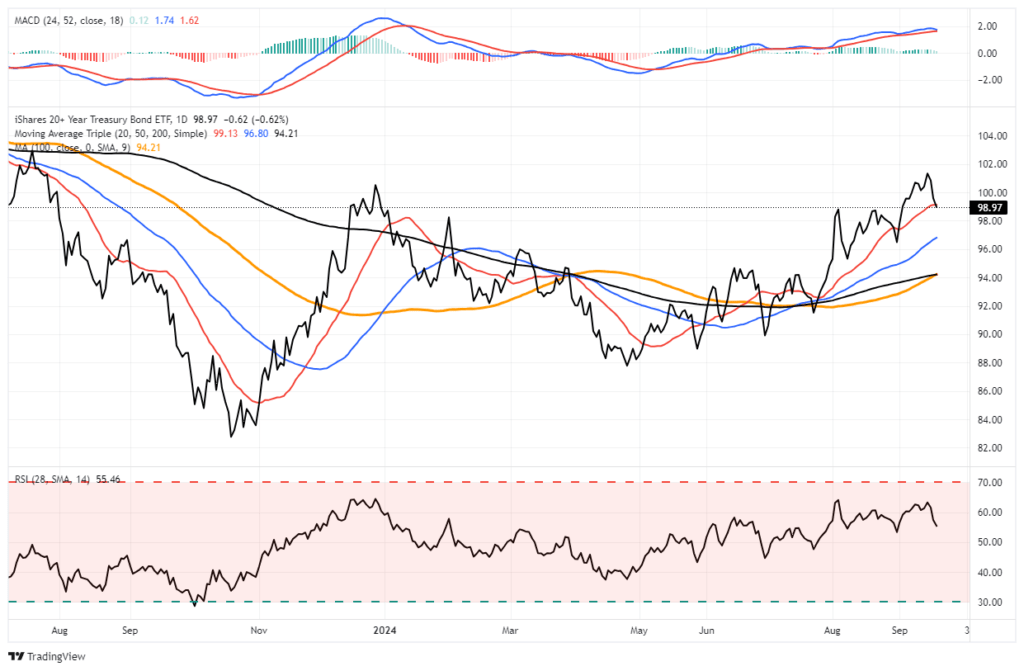 The Market Is Betting On Another 75bps In Cuts This YearIn its quarterly economic forecast, Fed members project, on average, that Fed Funds will end the year at 4.40%. The projection implies the Fed will cut rates by 50bps total over the next two meetings. The first table below, courtesy of the Fed, shows that of the 19 members polled, two think the Fed will not cut rates again this year. Seven members believe they will only cut once and by 25bps. Nine members are forecasting a total of 50bps, and only one thinks the Fed will cut by 75bps.The market has a different opinion. As implied by Fed Funds futures and shown in the second graphic, the market thinks the Fed will cut rates by 75bps over the last two meetings of the year. Furthermore, it implies there is an outside shot that they cut by 100bps, equating to 50bps at each meeting. With next week’s PCE price data, a new batch of labor data early next month, and the CPI report in mid-October, the Fed and the market will likely have better insight into what the Fed may do at the November 7th meeting.(Click on image to enlarge)(Click on image to enlarge) Large Caps Prosper While Small And Mid-Caps LanguishThe graph below, courtesy of Yardeni Research, shows that large-cap stocks have prospered while small and mid-cap ones have languished over the last two years. His graph shows that earnings between small, mid, and large-cap stocks are often well correlated. However, the earnings divergence between large versus small and mid-cap stocks has become notable. The difference is due to many factors. In our opinion, two factors likely have had the most impact.First, larger companies, especially those in the services field, have primarily been able to pass on inflation to their customers. Smaller companies have not had as much luck. With inflation moderating, this aspect driving the earnings gap should subside. Similarly, as a function of inflation, interest rates rose. Larger companies borrowed heavily in 2020 and 2021 at meager rates. Accordingly, in many cases, the effect of higher rates was negligible. Smaller companies do not have as much access to the bond markets and tend to rely more on floating-rate debt. As a result, their interest expense rose more than large companies. Therefore, these companies should see lower interest rate expenses and higher profit margins as rates decline.Assuming lower interest rates and inflation, the gap in earnings growth is likely to close. Therefore, everything else equal, small and mid-cap stocks may trade better than larger-cap stocks.(Click on image to enlarge) Tweet of the Day(Click on image to enlarge) More By This Author:Trump Or Harris: Corporate Tax Winners And LosersBull Steepening Is Bearish For Stocks – Part TwoQuarter End Window Dressing Will Become Monthly
