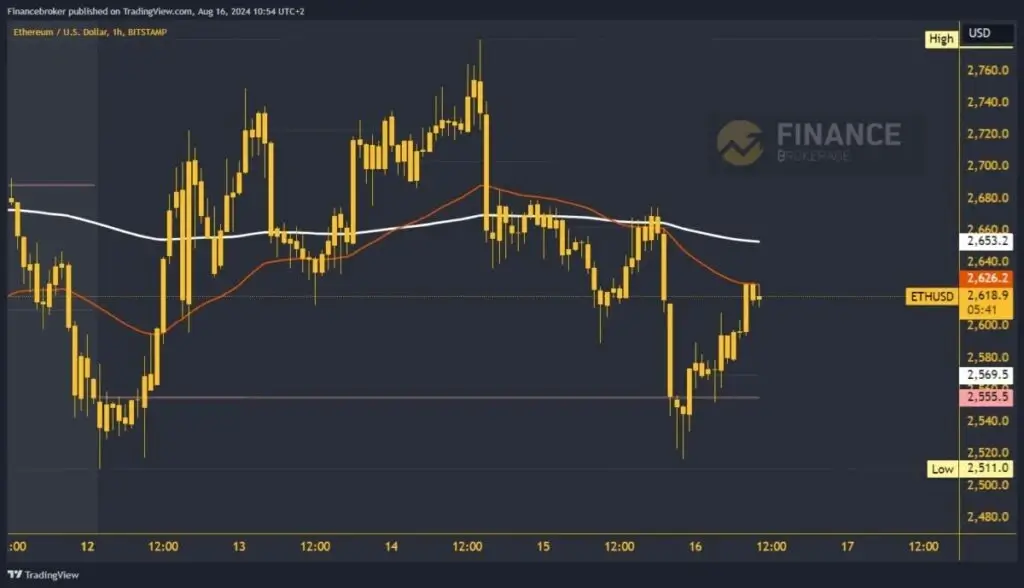
Ethereum chart analysisLast night, the price of Ethereum retreated to a new weekly low at the $2516 level. We have again descended into the support zone from the beginning of the week. Again, we managed to get back above the weekly open price and find that support. After a short , the price started a recovery and climbed above the $2580 level. The bullish momentum is still current, and a new daily high was formed at the $2625 level.Here, we encounter the EMA 50 moving average and are holding below it for now. We see a slight pullback to $2615, and for now, there are no sudden moves that would take us away from today’s path. We expect to see Ethereum advance above the EMA 50 and rise to a new daily high.(Click on image to enlarge) The new price pullback to the weekly open price is a worrying stepIn the $2650 zone, the price of Ethereum will meet the EMA 200 moving average, which was an obstacle for us in yesterday’s attempt to move above. This time we could do it, which would be great for further recovery to the bullish side. With the support of the EMA 200, the chances of reaching higher levels increase. Potential higher targets are $2680 and $2700 levels. This week’s Ethereum price high is at the $2780 level.For a bearish option, we need a negative consolidation and a retracement to start below $2600. With that step, we move away from the previous high and initiate a further pullback. At $2570, we will test the daily open price before continuing the decline to a new low. Potential lower targets are $2540 and $2520 levels. It is also possible to see a test of the $2500 level.More By This Author:Bitcoin Price Is Turning To The Bearish Side Again Gold And Silver: Gold Enters A Certain Consolidation Zone Mars Buys Pringles Maker Kellanova In $36B Deal
Ethereum Price Is Rebounding From Last Night’s Decline

