The Canadian dollar was mostly flat against most of its peers while it weakened a bit against the Greenback. Today’s key risk for the Canadian dollar is the release of the monthly GDP data, which is expected to be soft posting a 0.2% growth down from 0.3% last month. Most notably, the USDCAD and EURCAD are two pairs to bear in mind in lieu of today’s GDP data release.
The following table gives a snapshot of the important aspects that could influence the outcome of today’s GDP report. Bear in mind that besides the GDP m/m, the annualized GDP y/y will be released with the expectations of a slowdown to 2.8%, from 3.1% previously.
According to RBS, their view on Canadian GDP is bullish on account of trade surplus in July and a better than expected rise in manufacturing sales. A better than expected outcome could see the CAD crosses declines across the board riding on the loonie’s strength, especially against weaker currencies such as the Australian and Kiwi Dollar. The pairs are unlikely to react much if data comes in line with expectations. A worse than expected GDP reading could see the USDCAD rally higher while provide a short term corrective rally in the CAD cross currency pairs.
Canada Fundamentals
| Actual | Previous | Highest (Historical) | |
| Manufacturing PMI | 54.3 | 54.3 | 56.3 |
| Industrial Production | 4.89 | 3.92 | 11.4 |
| Retail Sales | -0.1% | 1.2% | 3.7% |
| Manufacturing Sales | 2.5% | 0.9% | 5.5% |
| GDP y/y | 3.1% | 8.54% |
USDCAD Technical Analysis
From the weekly charts, USDCAD closed on a very bullish note last week closing higher than the previous two weeks at 1.1169 with price in a well established uptrend from the weekly charts, with further upside moves likely targeting the previous high at 1.12281

On the daily charts, although price is in an uptrend well above its 200 day EMA, plotting an uptrend channel shows possible exhaustion to the rally with yesterday’s high coming in close to the upper channel resistance line. A bearish close today could see price head for a correction towards 1.096 levels to make more room for further rally to the upside. The support level of 1.096 is a well established support and could very well hold ground. The Stochastics oscillator, at the time of writing is in the overbought levels pointing to a possible corrective move.

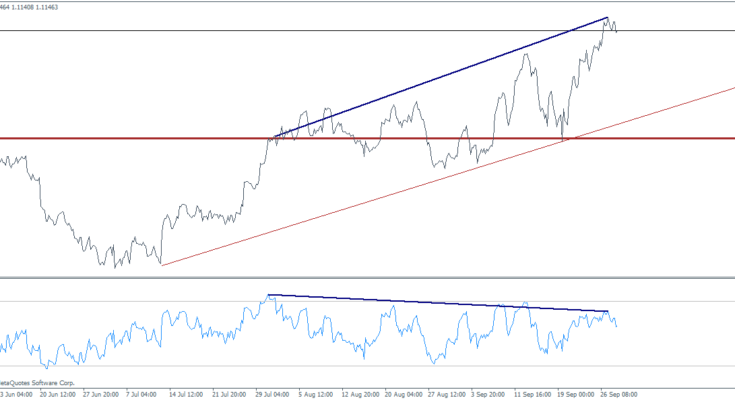
Switching to the H4 charts and comparing with the 13 period RSI we can see a clear bearish divergence in place with USDCAD making a higher high against the RSI’s lower high. The divergence if validated could see price correct itself towards 1.091 support zone which could in effect be a dip in the rally. Any corrective moves should be taken with caution ahead of the US monthly NFP data due this Friday.


