Part 3: A Brief Summary. For Details See Part 1: Introduction To Double Bollinger Bands, Part 2: A Continuation That Presents Specific Rules And Examples
This is part of FXEmpire’s continuing series of special features on trader education, and provides a solid basis for understanding double Bollinger bands. For more detailed coverage, and examples, see Chapter 8 of the book, The Sensible Guide To Forex.
Here’s a brief illustrated summary of the 4 rules for using double Bollinger bands (DBBs). Like any technical indicator signals, these should be confirmed by your preferred technical and fundamental indicators. For background information, full details and illustrations of each rule, see our articles Part 1 and Part 2. For a video introduction to double Bollinger®bands based on my book, see fxacademy’s free course here.
RULE 1: Go Short & Stay Short, When Price Is In Or Below The DBB “Sell Zoneâ€
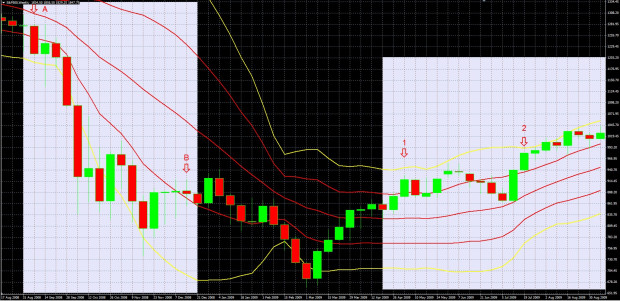
When price is in the sell zone, downward momentum is strong enough for the odds to be in favor of continued downtrend. This rule applied from the week of September 7th (arrow A) until the week of December 14th (arrow B) in Chart 1 below.

Â
CHART 1: S&P 500 Weekly Chart Sept. 7th – Dec. 14th 2008 – SELL ZONE Framed By Arrows A and B Within Highlighted Area
Source: MetaQuotes Software Corp, www.fxempire.com, www.thesensibleguidetoforex.com
01 Feb. 25 20.10
RULE 2: Go Long & Stay Long, When Price Is In Or Above The DBB “Buy Zoneâ€
When price is in the buy zone, upward momentum is strong enough for the odds to be in favor of continued downtrend. The rule applied for most of the period between arrows 1-4 in Chart 2 below.

CHART 2: S&P 500 Weekly Chart March 8 2009 – April 4, 2010 BUY ZONE Framed By Arrows 1 To 4 Within Highlighted Area
Highlighted area: April 19, 2009 – 31 January 2010

