In this morning’s 5 Day Forecast, Adam O’Dell, our Chief Investment Strategist, gave a snapshot of what 2015 was like for stocks, bonds and commodities.
The picture was ugly!
So I’m going to show you too, but I’m going to let charts do the talking…
Since early 2006 we’ve seen a series of major bubble tops. It started with real estate. Then it was emerging market stocks in late 2007, commodities and oil in mid-2008, gold in late 2011, Treasury bonds in mid-2012, junk bonds in mid-2013, and finally stocks in mid-2015 (although the largest cap indices could still eke out a slight new high by late January, but that looks less likely now with the way stocks started today).
The result is that 2015 has the unpleasant distinction of being the first year since 2008 when none of the major sectors made gains… and unless you were following a good trading system like Boom & Bust, Cycle 9 Alert, Max Profit Alert, Treasury Profits Accelerator, Triple Play Strategy or Forensic Investor, you most likely didn’t make any money in the markets last year!
Let’s look at the details, from worst to… well… less bad…
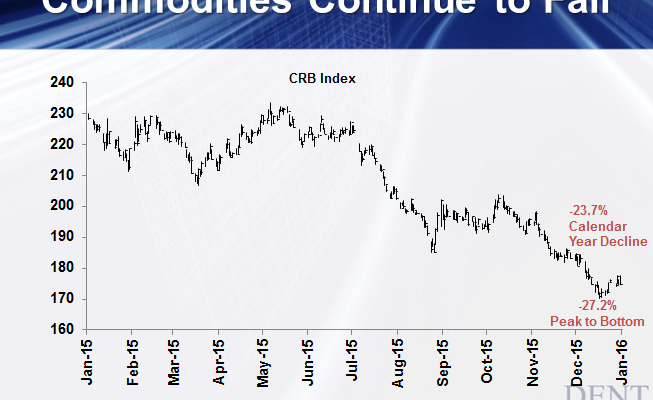
The leading loser continues to be commodities, which are down 23.7% for the calendar year (January to December 2015) and 27.2% from the high to the low for the year.
Oil was down 31.1% for the year and 45.7% from high to low.
Gold was down 10.5% and 19.7%, respectively.

Â
Emerging market stocks performed poorly too because most followed declining commodity prices. The EEM ETF was down 17.6% for the year and a whopping 32.1% from high to low.

Â
Then comes junk bonds, which were down 10.1% for 2015 and 15.0% at the extremes.
We can actually go back farther here and show how we clearly called the exact top in mid-2013! Junk bonds are down 17% since then and Boom & Bust subscribers have been able to profit from this decline.

